Benchmarks
Aiken has built-in support for benchmarking through a syntax similar to property-based tests. Benchmarks allow you to measure execution costs (memory and CPU) across increasing input complexity.
Writing benchmarks
To write a benchmark, use the bench keyword along with a Sampler. A Sampler takes a size parameter and generates increasingly larger inputs based on a specified growth pattern (typically constant or linear). In fact, a Sampler is defined as such:
type Sampler<a> = fn(Int) -> Fuzzer<a>Hence, samplers can be constructed from fuzzers quite easily using the aiken-lang/fuzz (opens in a new tab) package and used in a similar fashion. A Sampler is introduced as a special annotation for the argument using the via keyword.
use aiken/fuzz
use aiken/primitive/bytearray
use aiken/primitive/int
fn sample_bytearray(size: Int) -> Fuzzer<ByteArray> {
fuzz.bytearray_between(size * 128, size * 128)
}
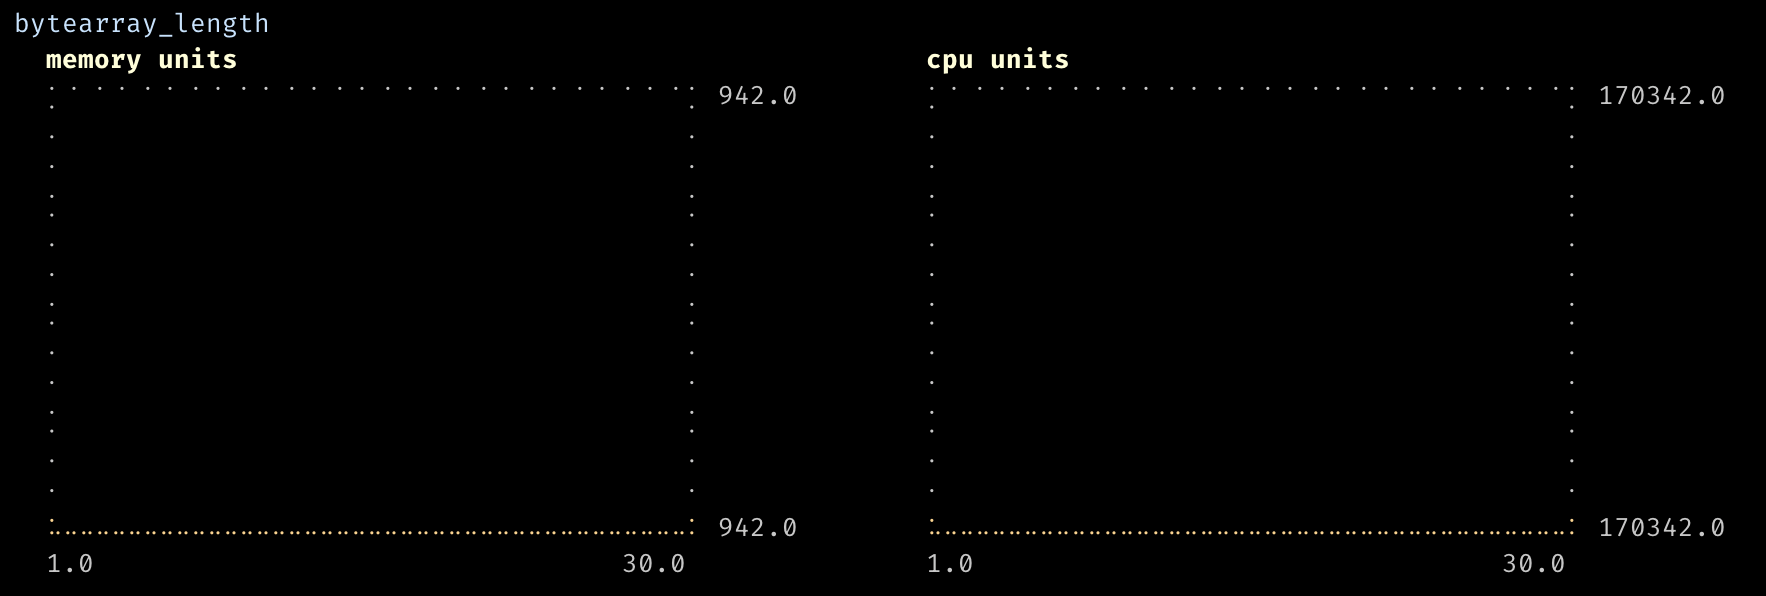
bench bytearray_length(bytes: ByteArray via sample_bytearray) {
bytearray.length(bytes)
}
// Note, you can also omit the `: ByteArray` type annotation
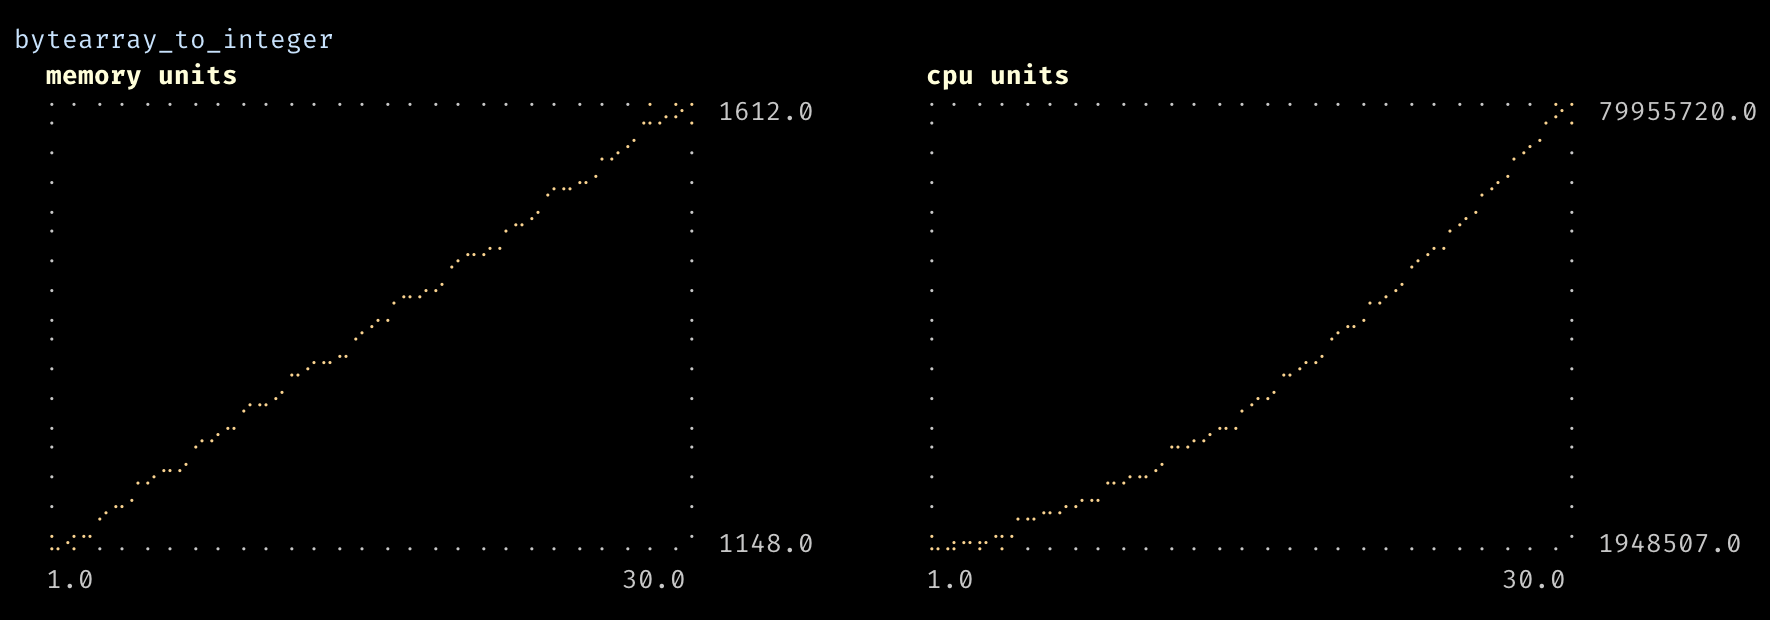
bench bytearray_to_integer(bytes via sample_bytearray) {
int.from_bytearray_big_endian(bytes)
}The size will grow linearly from 0 to --max-size (30 by default). It is then up to the sampler to define how the generated value should grow. For example, it's totally possible to generate values that grow quadratically in terms of the size:
fn sample_bytearray_quadratic(size: Int) -> Fuzzer<ByteArray> {
  fuzz.bytearray_between(size * size, size * size)
}
It's also possible, like in sample_bytearray above to scale the size further to ensure benchmarks capture interesting behaviours.
Running benchmarks
Benchmarks are collected using the aiken bench command. They provide a report showing execution costs (in abstract memory and CPU units) in terms of a monotically increasing size.
JSON Output
By default, the bench command will generate plot charts in your terminal, since they are immediately visual and can help spot behaviours in a glance. You can also obtain the complete dataset of points used for the plot by redirecting the standard output to a file.
aiken bench > benchmarks.jsonThe output is a structured JSON file containing all results for your benchmarks. Handy if you want to conduct your own analysis!
Filtering benchmarks
Like tests, you can run specific benchmarks using the usual command-line options:
# Run benchmarks in specific module
aiken bench -m "my_module"

# Run specific benchmark
aiken bench -e -m "my_bench"
Benchmarks are particularly useful when optimizing validator scripts since they allow you to measure execution costs across different input sizes and complexity levels.
For more information about the testing functionality that benchmarking builds upon, see the testing documentation.